|
All data/images within this page are hereby acknowledged property of or copyright of the National Oceanic and Atmospheric Administration (NOAA), the Canadian Space Agency (CSA), the University of Iowa (UI), and all respective rights holders.
|

|
Evidence of Coronal Stream
This graph perhaps could show the arrival of a weak coronal stream. I say perhaps, (and most likely an incorrect value from ACE) as the only area that supports this is the density level. Generally, coronal streams are characterized by rapid (usually instant) increases in speed, low (lower) density, and are often unipolar of moderate strength (I struggle to say the above, as it sometimes portrays values completely opposite of what is stated! Quite frankly, It seems this whole area would fit into that realm!).
|
|

|
Goes Electron Flux (Waves)
Captured here are varying electron levels, that seem to be sent in cycles over time (much like the distinctive waves-over-time, that also appear on the L1 mag during the same periods).
|
|

|
Baseline Trouble
The Canopus team has an excellent page on the usefulness of CU/CL versus AE, AL and AE as parameters.
|
|
|
|
|
Beacon Signal Levels
Here is a comparison compiled by Doug, (VE5UF) howing relative signal strength versus time, from his home qth in DO61.
|
|
|
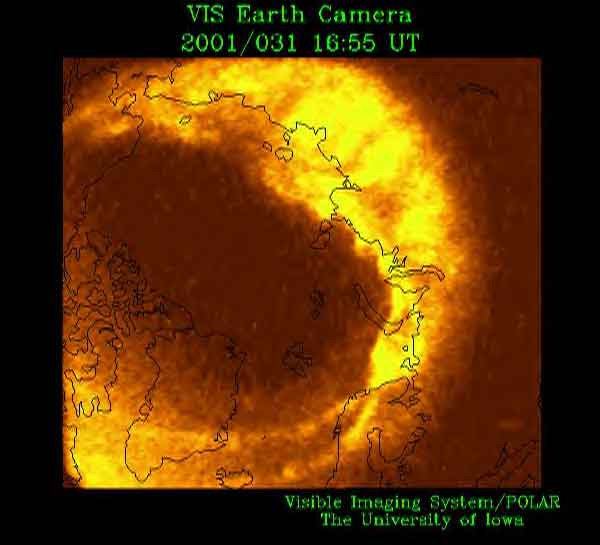
Oval Expansion
What a night it must have been in Northern Siberia!
|
|